
Economic Diversity is about Opportunity
Public libraries, as infrastructure and as service provider, interact with the three primary measures of economic diversity we used here: income inequality (Gini Coefficient), diversity of industries people work in (Occupational Diversity), and the portion of people actively looking for work who are employed (Unemployment Rate). From hosting small business centers and start-up labs, to making employment resources available, public libraries are actively working to be part of the diversification of local economies.
Read More
Libraries are pivotal in creating opportunities for all community members, contributing to a more equitable and economically diverse society. Themes from our qualitative data highlight the multifaceted role of libraries in promoting economic diversity by providing resources and support that help reduce income inequality, foster a diverse range of industries, and lower the unemployment rate:
- Libraries as Equalizers of Opportunity
- Public libraries provide free access to educational resources, technology, and internet services, which help bridge the gap caused by income inequality. They ensure that all community members, regardless of their economic status, have access to essential information and opportunities for learning and development. This free access is particularly vital for those who cannot afford these resources otherwise, making libraries a critical tool in mitigating the effects of income inequality.
- Libraries as Hubs for Workforce Development
- Libraries support the diversification of local economies by hosting small business centers and startup labs. These facilities provide resources and support for entrepreneurs, helping to foster a diverse range of industries within the community. Libraries offer various programs and workshops aimed at developing skills in different industries, thereby promoting occupational diversity.
- Libraries as Collaborative Spaces
- Libraries facilitate connections between businesses, organizations, and individuals by acting as community hubs. This collaboration can lead to a more diversified local economy as libraries often host events that bring together people from different sectors. These events help to break down silos and encourage the sharing of ideas and resources across different industries.
- Libraries as Job Search Support Centers
- Libraries provide crucial support for job seekers by offering access to job listings, resume writing workshops, and interview preparation resources. They also provide access to computers and the internet, which are essential tools for job hunting. These services become even more critical during economic downturns as they help community members find employment and reduce the unemployment rate.
- Libraries as Lifelong Learning Centers
- Libraries promote lifelong learning and skill development, which are essential for maintaining employability in a rapidly changing job market. By offering courses and resources that help individuals develop new skills or improve existing ones, libraries contribute to reducing unemployment and enhancing economic stability within the community.
How to Use these Dashboards
This Dashboard is interactive and you can change what you are looking at. Here are some tips to get you started:
- Limit your search: When the headings read “All, All”, it means there are no filters in action and you are seeing the average of All counties in All states. Type the abbreviation for a US state (data do not include territories), and you’ll see a limited list of counties that are ONLY in the that one state. {If you try to deselect counties one at a time, you’ll run into error prone results – Tableau just can’t handle calculations that many unique observations on the fly.}
- Geographic filters apply everywhere: Once you select a state or specific county(ies) within a state, the filter will apply to all the tables and graphics in the Dashboard.
- Measure Names menu: You can also look at specific measures of Economic Diversity geographically using the drop down menu called “Measure Names”. By default it is showing you the average of all the averages of all our available data put together. The result is nonsense. Select whichever measure you would like to compare across geographies. It will depend on the measure if a higher value is “better” or “worse”. For instance, higher unemployment could be viewed as bad where higher diversity in income could be good. It will depend on your judgement!
- Year Filter: You can filter the map by year. It won’t change the other charts and tables. When more than one year is selected, the average across years is displayed.
- Map: The map has its own set of controls on the left of the map window. The magnifier will let you search the map by county or state name and zoom in to the center of your selected location. Plus and minus symbols will zoom in and out. Home will return to a view of the continental US (zoom out to view Alaska and Hawaii). Clicking the right facing arrow will reveal a menu for mouse controls. From here you can say you would like to cruise around the map by selecting the four way arrows, clicking, and dragging the map to change the view. Those options with dotted outlines are varied ways of selecting locations on the map.
- Widen your view: There are two ways to expand the dashboard beyond the container our website forces. You can select “View on Tableau Public” on the bottom left of the window. This will take you to the dashboard on Tableau Public’s website. You can also select full screen by clicking the square between download and share at the bottom right of the window.
- Report out with Download & Share features: The bottom right of the dashboard frame gives a bunch of useful tools for viewing. The rectangle with the down arrow will download your customized result in whatever format you prefer (including the table we used to make all this!). You can also use the share button to send a link to your customized view or the original view.
How to Read the Dashboard Above
The Economic Diversity Index used in the calculator is the sum of measures, standardized at the density within US region level, with data taken from US Census Bureau tables:
- Gini Coefficient: Named after Corrado Gini, the value gives us a statistical measure of income inequality where 1 is total inequality and 0 is total equality. For example, a Coefficient equal to 1 would be a town with two people where one made a million dollars and the other made one hundred. Our data comes from the US Census Bureau’s calculation.
- Occupational Diversity Index: This index gives us a statistical measure of diversity of industries people are working in where 1 is no diversity at all and 0 is every worker is employed in a different industry. We calculate this using the Simpson’s Diversity Index formula from American Community Survey occupation statistics.
- Unemployment Rate: Unemployment rate is given as a whole number percentage (like 7 for 7%), and it’s the number of people who have NO job at all who want to have a job. In this calculation, working 10 hours a week is employed and leaving work because you would make less than it costs to put a kid in childcare is not in the labor force (not unemployed). This is also a US Census Bureau calculation.
The Dashboard describes Economic Diversity in four ways:
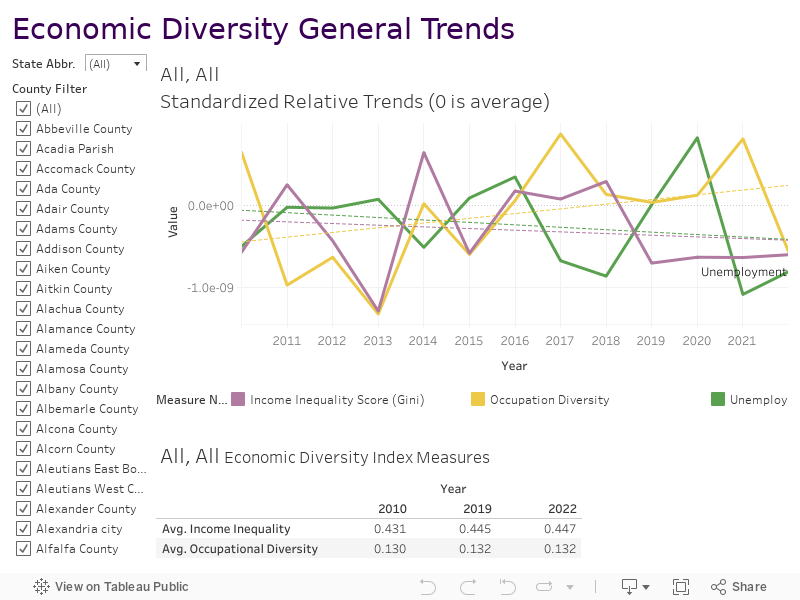
- Trend lines: Each line represents one of the measures but the values are given in z-scores. This is a standardization method where the average is 0 and the deviation is 1. The group of counties used to create the “standard” is every level of rurality or urbanity within every US region. We give smooth trend lines which are dotted so it’s easier to see if over the years, this measure is going up or down. At the national level, even though the lines look very dynamic, all the values are smaller than either positive or negative 0.0000.
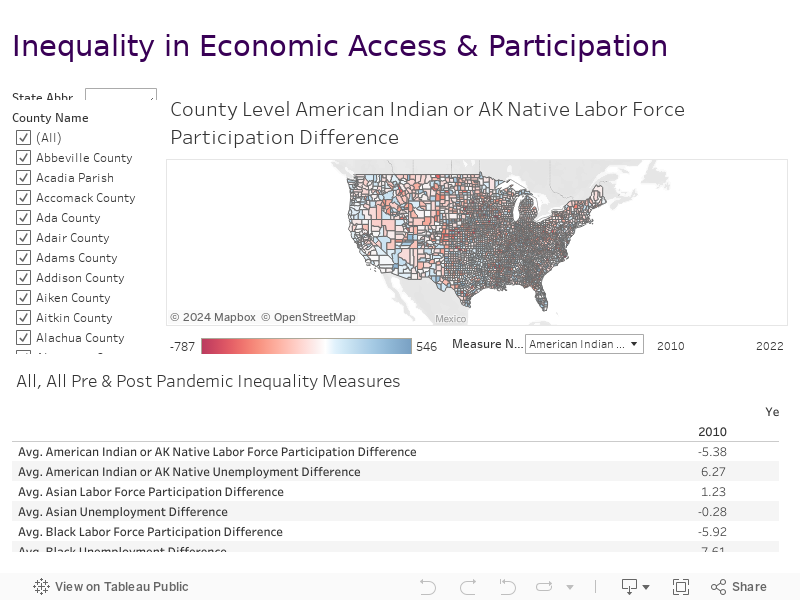
- Tables: There are two tables with unstandardized averages. All are based on rates or percentages already scaled by population size, but not further adjusted for region or rurality. Indexed measures named above are given for two years: 2010 and 2022. Economic Inequality Measures are given as rate differences in Labor Force Participation (LFP) or Unemployment between a historically disadvantaged group minus a historically advantaged group. So, Avg. Am Indian or AK Native LFP Diff is calculated by taking the LFP rate for American Indians or Alaska Natives (federal government terms) and subtracting the LFP for White, non-Hispanics. For all “Diff” variables, the closer to 0, the less inequality between people based on reported characteristics. These are given for 2010, 2019, and 2022.
- Interpretation of Index Table: Based on those snapshots in time, one would infer that the US has increasing income inequality, steady or barely decreasing occupational diversity, and significantly lower unemployment in the wake of COVID than in the second half of the great recession.
- Interpretation of Inequality Table: Overall, gaps based on averages of population groups are declining. The difference in LFP for HS graduates versus Bachelor’s degree holders continues to grow. Unemployment and LFP are related measures, where LFP can tell us the portion of the population who has left or been forced out of work and are no longer captured in the unemployment rate. This can happen for systemic reasons, like when COVID school and day care closures forced many workers who couldn’t work remotely to leave work.
- Map: The interpretation above tells a national average story, but there is a wide variety of outcomes across US counties. The map can help you see differences nationally, within a state, and changes over time. Here is an example of use and interpretation of a mesure:
- Set up: Select “Avg. Female Unemployment Diff” from the Measure Values menu. The is the unemployment rate difference between self-identified females and males living alone with not children (so we can set aside child care as a cause). We haven’t yet filtered by year.
- Observations: Looking at the nation as a whole, we see the most pale colors in the northeast, along the coasts, and much of the border with Canada. We see more saturated color, indicated bigger differences between people according to gender category, through Appalachia (gold), the southern Mississippi delta (purple) and throughout the west.
- Interpretations: Notice the Measure Values color legend. There are places where rates of unemployment are 15.84% higher for men than women, and places with 7.65% higher unemployment for women than men. These are based on all years averaged together. Slide the year slider to only show 2010. The general patterns are the same, but the inequality is widened and is more prevalent. In 2019, there are counties that are even more extremely unequal, but fewer of them, with most of the nation becoming paler. In 2022 those sites of deepest inequality are fewer and also worse: at the extremes, men with 43% higher unemployment rate than women, and women with 25.7% higher unemployment rate than men. We could interpret this evidence to mean that across the nation, women living alone without children are slightly more likely to have work if they want it, but there are geographic patterns that persist over time to gendered disparity in unemployment rate.
Outcomes are Co-Produced - Coming Soon!
Mediation analysis results, discussion of the library contribution in panel regression models to this outcome overall, and then talk about the mechanisms at work (why would there be positive/negative relationships, and when can we use causal language?)
Service Considerations
Libraries as Equalizers of Opportunity
- Free Access to Resources: Ensure free access to educational resources, technology, and internet services, prioritizing outreach to underserved and economically disadvantaged communities. Provide industry-standard software and tools for graphic design, coding, digital marketing, and more.
- Expand Access to Digital Resources: Provide a range of e-books, online courses, and educational databases that can be accessed remotely, making it easier for those who cannot physically visit the library.
- Resource Awareness: Develop and implement strategies to raise awareness about available resources among those who may benefit most, including targeted marketing and partnerships with local organizations.
- Inclusive Programs: Design programs that specifically address the needs of economically disadvantaged individuals, ensuring that all community members can access opportunities for learning and development.
- Remove Barriers to Access: Implement fine-free policies to ensure that all community members can access library resources regardless of their financial situation. Provide transportation assistance or mobile library services to reach underserved areas.
Libraries as Hubs for Workforce Development
- Small Business Centers: Establish or enhance small business centers and startup labs within libraries, providing resources, mentorship, and support for aspiring entrepreneurs.
- Industry-Specific Workshops: Offer workshops and programs tailored to different industries, promoting skill development and occupational diversity within the community. Offer entrepreneurship, business planning, marketing, and other essential skills workshops. Partner with local industries to offer training programs and certifications that align with the job market’s current needs.
- Partnerships with Local Businesses: Partner with local businesses and economic development organizations to support workforce development initiatives and provide real-world learning opportunities.
Libraries as Collaborative Spaces
- Community Events: Host events that bring together individuals from various sectors, including business, education, and non-profit organizations, to encourage collaboration and the sharing of ideas and resources.
- Networking Opportunities: Foster community and support economic diversification by creating networking opportunities, including industry meetups, panel discussions, collaborative projects, and mentorship programs that connect new entrepreneurs with experienced business owners.
- Innovation Hubs: Develop innovation hubs or maker spaces where community members can collaborate on projects, share resources, and develop new ideas that contribute to local economic growth.
Libraries as Job Search Support Centers
- Job Search Resources: Provide and maintain comprehensive job search resources, including access to job listings, resume writing workshops, cover letter crafting, and interview preparation sessions. Host regular job fairs and employer meet-and-greet events.
- Technology Access: Ensure that computers and internet access are readily available for job seekers, particularly during economic downturns.
- Employment Counseling: Provide one-on-one job search assistance, employment counseling, and career development services to improve employability. Offer career counseling to help individuals identify their strengths and interests.
Libraries as Lifelong Learning Centers
- Skill Development Courses: Offer diverse skill development courses and resources, ranging from basic literacy and numeracy to advanced technological skills and professional certifications. Include technology, language learning, and soft skills, and utilize online platforms like Coursera and LinkedIn Learning for certification programs.
- Promote Vocational and Technical Training: Develop and promote vocational and technical training programs in collaboration with local trade schools and community colleges. Offer resources and support for non-traditional career paths, including the arts, trades, and emerging tech fields.
- Adult Education Programs: Develop adult education programs that cater to various learning needs, including GED preparation, ESL classes, and continuing education opportunities.
- Adaptability and Relevance: Regularly update educational offerings to ensure they remain relevant to the evolving job market and community needs, supporting ongoing employability and economic stability.
Libraries as Community Anchors
- Safe and Inclusive Spaces: Ensure libraries are safe, welcoming, and inclusive spaces where all community members feel valued and supported. Provide materials and resources in multiple languages to serve diverse populations. Ensure that all programs and resources are accessible to people with disabilities. Design library spaces to be flexible and multifunctional, accommodating a variety of activities and user needs.
- Community Outreach and Partnerships: Strengthen partnerships with local schools, colleges, businesses, and nonprofit organizations to enhance resource sharing and program offerings.
- Holistic Support Services: Integrate support services such as legal aid, financial literacy workshops, and access to social services to address broader aspects of economic well-being.
- Feedback and Improvement: Implement regular feedback mechanisms and community needs assessments to continuously improve services, better supporting economic diversity and inclusion by tailoring programs to specific community needs.
Evidence for Positive Impact - Coming Soon!
Heavily empirical section, including our panel regression results demonstrated over all positive impacts and trends in impact. Where possible include other methods like COVID-19 shock in recovery. Think of this in three parts: quantitative evidence, themes from focus groups and local research, and literature review
Technical Notes - Coming Soon!
This is all the specific data manipulation and management, code used in analysis, sources for each and all data, and data files for reference which include (where applicable) margins of error for all measures. OSF repository for Economic Diversity Index: https://osf.io/hjs6c/