
Economic Wellbeing is about Lifelong Outcomes
The measures included here: educational attainment, income, and income sources, are all heavily correlated with wellbeing across a person’s life span. Public libraries interact with each element differently and mitigate the negative impact of low economic wellbeing through formal services and informal relationship building. Whether economic wellbeing is a death sentence or a bearable burden depends, in part, on a person’s connections and attachments. This is a service dimension library workers are expert in.
Read More
Qualitative data illustrates how public libraries significantly contribute to economic wellbeing through educational support, resource provision, community cohesion, and technological access. Below is a breakdown of key themes:
- Libraries as Lifelong Learning Center
- Libraries offer diverse programs and resources for continuous education, including ESL classes, life skills workshops, and GED support.
- Libraries promote lifelong learning for all ages, from STEM initiatives for young learners to technology workshops for seniors.
- By providing access to information and technology, libraries help individuals improve their skills and knowledge, which can lead to better job opportunities and higher incomes.
- Support for Formal Education
- Libraries enhance educational outcomes through collaborations with schools, offering homework help, tutoring, and study materials.
- By partnering with schools and community organizations, libraries supplement formal education and support personal and professional development across the lifespan.
- Skill Development Programs
- Libraries offer various skill development programs, such as computer literacy, coding classes, and vocational training, which can enhance individuals’ skill sets and open up new income-generating opportunities.
- Providers of Free Resources
- Libraries offer a wide array of free resources, including books, educational software, and internet access, which are crucial for individuals who cannot afford these otherwise.
- This service reduces financial burdens and promotes economic equity, addressing critical needs and serving as vital community equalizers.
- Technological Access and Digital Literacy
- By integrating technology and bridging the digital divide, libraries ensure equitable access to resources.
- They offer digital databases and laptops, essential for educational attainment and economic empowerment in the digital age.
- Support for Job Seekers
- Libraries provide essential resources for job seekers, such as internet and computer access, resume-building workshops, and job search assistance.
- They offer programs to improve employability skills, including computer literacy training, directly impacting individuals’ ability to find employment and improve their income.
- Social Safety Nets
- Libraries act as informal social safety nets, offering essential services and safe spaces for vulnerable populations.
- They support community cohesion through social interaction and programs, providing access to social services, information on government assistance, legal aid, and hygiene facilities.
- Libraries are hubs for social services and community support, helping marginalized individuals integrate into their communities.
- Supporting Vulnerable Populations
- Libraries cater to the needs of vulnerable populations, including the homeless, low-income families, and new immigrants, by providing safe spaces, social services, and programs that facilitate social integration and economic mobility.
- Libraries as Community Barometers
- The state of a library serves as an indicator of the community’s economic health and priorities.
- Well-maintained libraries signal effective governance and investment in community wellbeing.
- Community Resilience and Networking
- Libraries facilitate community bonding and networking, which can enhance economic resilience. Their programs and events help individuals build relationships and networks that lead to economic opportunities and support.
- Economic Empowerment
- Libraries provide workshops and resources on financial literacy, helping individuals manage their finances, understand budgeting, and make informed decisions.
- By democratizing access to information and educational resources, libraries empower individuals to improve their socio-economic status, contributing to social equality and community well-being.
How to Use these Dashboards
This Dashboard is interactive and you can change what you are looking at. Here are some tips to get you started:
- Limit your search: When the headings read “All, All”, it means there are no filters in action and you are seeing the average of All counties in All states. Type the abbreviation for a US state (data do not include territories), and you’ll see a limited list of counties that are ONLY in the that one state. {If you try to deselect counties one at a time, you’ll run into error prone results – Tableau just can’t handle calculations that many unique observations on the fly.}
- Geographic filters apply everywhere: Once you select a state or specific county(ies) within a state, the filter will apply to all the tables and graphics in the Dashboard.
- Measure Names menu: You can also look at specific measures of Economic Wellbeing geographically using the drop down menu called “Measure Names”. By default it is showing you the average of all the averages of all our available data put together. The result is nonsense. Select whichever measure you would like to compare across geographies. It will depend on the measure if a higher value is “better” or “worse”. For instance, higher poverty might indicate a problem where higher college education could be good. It will depend on your goals!
- Year Filter: You can filter the map by year. It won’t change the other charts and tables. When more than one year is selected, the average across years is displayed.
- Map: The map has its own set of controls on the left of the map window. The magnifier will let you search the map by county or state name and zoom in to the center of your selected location. Plus and minus symbols will zoom in and out. Home will return to a view of the continental US (zoom out to view Alaska and Hawaii). Clicking the right facing arrow will reveal a menu for mouse controls. From here you can say you would like to cruise around the map by selecting the four way arrows, clicking, and dragging the map to change the view. Those options with dotted outlines are varied ways of selecting locations on the map.
- Widen your view: There are two ways to expand the dashboard beyond the container our website forces. You can select “View on Tableau Public” on the bottom left of the window. This will take you to the dashboard on Tableau Public’s website. You can also select full screen by clicking the square between download and share at the bottom right of the window.
- Report out with Download & Share features: The bottom right of the dashboard frame gives a bunch of useful tools for viewing. The rectangle with the down arrow will download your customized result in whatever format you prefer (including the table we used to make all this!). You can also use the share button to send a link to your customized view or the original view.
How to Read the Dashboard
The Economic Wellbeing Index used in the calculator is the sum of measures, standardized at the density within US region level, with data taken from US Census Bureau tables:
- Educational Attainment: Portions of the population aged 25 years or more with no high school diploma or equivalence and those with a Bachelor’s degree or more, are given. These are given as whole numbers, but they are percentages. Read 20 as 20%.
- Income: This index includes multiple views of income: the portion of households reporting income below the poverty line in the last 12 months (Poverty), and dollar values for both median household income and per capita income.
- Median is different than average in that it is less skewed by wildly low or high incomes: if you list every person’s income out, the median is the income that is in the exact middle of the list. Per capita is the total income divided by whatever the population of the county is. All of these are calculated by the Census Bureau. For the raw dollar values, they represent the year reported’s value (nominal, not adjusted for inflation), and the K stands for thousand. Read $45K in 2010 is $45,000 in 2010 dollars.
- Participation: Labor Force Participation Rate is included in Economic Wellbeing because attachment to a regular job is an important driver in whether income will have significant detrimental effects on a person’s life expectency and health. There are many reasons why people aren’t in the labor force, like disability, parenting, and elder care giving. Also include in particpation is the portion of households engaged in investment – this let’s us know if we have robust and distributed engagement in real estate and business, or if investment participation (and the benefits of investing) are reaped by a lot of folks, or just a few. Measured as the portion of households with income from investments in the form of stocks or real property (Investment). Here again, read 58 as 58%.
The Dashboard describes Economic Wellbeing in four ways:
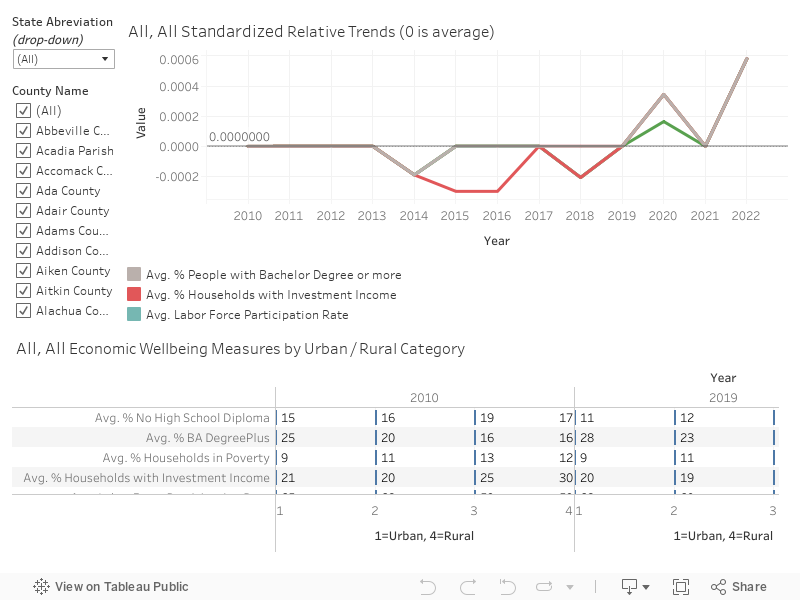
- Trend lines: Each line represents one of the measures but the values are given in z-scores. This is a standardization method where the average is 0 and the deviation is 1. The group of counties used to create the “standard” is every level of rurality or urbanity within every US region. We give smooth trend lines which are dotted so it’s easier to see if over the years, this measure is going up or down. At the national level, even though the lines look very dynamic, all the values are smaller than either positive or negative 0.0000.
- Tables: There are two tables with unstandardized averages. All are based on rates or percentages already scaled by population size, but not further adjusted for region or rurality. Indexed measures named above are given for two years: 2010 and 2022 and broken out by the density categories used on the calculator page with 1 = Urban, 2 = Suburban, 3 = Small Town, 4 = Rural. Inequality Measures are given as rate differences in Median Household Income (MHI) and Poverty Rates between a historically disadvantaged group minus a historically advantaged group. So, Avg. Am Indian or AK Native MHI Diff is calculated by taking the MHI for American Indians or Alaska Natives (federal government terms) and subtracting the MHI for White, non-Hispanics. For all “Diff” variables, the closer to 0, the less inequality between people based on reported characteristics. These are given for 2010, 2019, and 2022.
- Interpretation of Index Table: Based on those snapshots in time, one would infer that the US has increasing educational attainment, increasing income (in nominal terms), and decreasing economic participation, and that in almost all of these measures, small town and rural communities lag behind their suburban and urban counterparts.
- Interpretation of Inequality Table: Nationally, poverty rate differences between racialized ethnic groups is decreasing, but female/male and HS/BA graduate poverty differences is slowly and mildly growing. The differences in MHI is steady or growing over our trend period with Black American households seeing the worst income gaps.
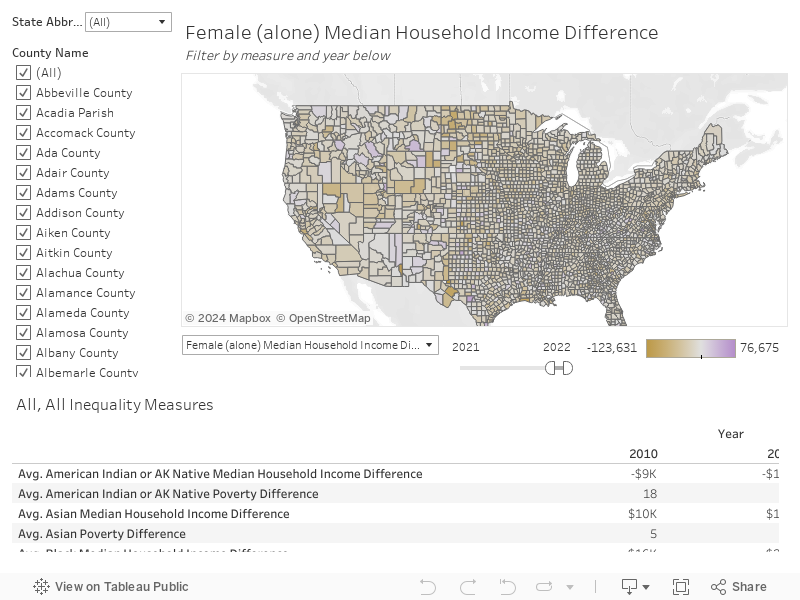
- Map: The interpretation above tells a national average story, but there is a wide variety of outcomes across US counties. The map can help you see differences nationally, within a state, and changes over time. Here is an example of use and interpretation of a measure:
- Set up: Select “Female (alone) Median HH Income Diff” from the Measure Values menu. The is the dollars in-hand difference between self-identified females and males living alone with not children (so we can set aside child care as a cause). We haven’t yet filtered by year, so the amounts are the sum of the differences over all 13 years in our data.
- Observations: Looking at the nation as a whole, we see predominantly gold throughout the continental US and purple in the half of Alaska furthest from the lower 48. Overall, the gold throughout the continental US is pale with stripes of saturation (more intense inequality) in North Dakota, Wyoming, Utah & Nevada, and then again from the Texas panhandle north through South Dakota.
- Interpretations: Notice the Measure Values color legend. These numbers are huge. If we keep no year filtering, we can see that nationally, women lose out on paychecks. Let’s make interpretation easier by looking at a particular region: something we can only do in the map. Click the right facing arrow from the map navigation bar and select the dotted box, and highlight the southeast from eastern Oklahoma to the east coast and south through the Gulf including Florida. Select the four way arrows to be able to drag and zoom in on your highlighted area. Limit the years to COVID and forward. There is almost no purple, and although not every county is gold, most of them are. From 2020 forward, this region of the US has areas of intense income inequality for female workers.
Outcomes are Co-Produced - Coming Soon
Mediation analysis results, discussion of the library contribution in panel regression models to this outcome overall, and then talk about the mechanisms at work (why would there be positive/negative relationships, and when can we use causal language?)
Service Considerations - Coming Soon
Libraries as Lifelong Learning Centers
- Diverse Educational Programs: Continuously develop and offer a wide range of educational programs, including ESL classes, life skills workshops, and GED support to cater to various age groups and learning needs.
- STEM and Technology Workshops: Implement STEM initiatives and technology workshops for different age groups to promote lifelong learning and skill enhancement.
- Information and Technology Access: Maintain and update resources and technology to provide continuous access to information and tools to improve individuals’ skills and knowledge, thereby enhancing job opportunities and income potential.
Support for Formal Education
- School Partnerships: Strengthen collaborations with schools to offer homework help, tutoring, and access to study materials, supplementing formal education.
- Community Organization Collaborations: Partner with community organizations to support personal and professional development through various educational programs and resources.
- After-School Programs: Develop after-school programs that provide additional educational support and enrichment activities for students.
Skill Development Programs
- Computer Literacy and Coding Classes: Offer regular classes on computer literacy, coding, and other in-demand skills to enhance individuals’ employability.
- Vocational Training: Partner with local businesses and training organizations to offer vocational courses. Provide vocational training programs that teach practical skills relevant to local job markets, such as resume writing and interview preparation.
- Certification Programs: Introduce certification programs that allow participants to gain recognized credentials in various fields.
- Life Skills Programs: Offer life skills workshops covering areas such as financial literacy, health education, and parenting skills.
Providers of Free Resources
- Comprehensive Resource Availability: Ensure a wide array of free resources, including books, educational software, and internet access, are readily available to all community members. Ensure that theycan be accessed remotely, making it easier for those who cannot physically visit the library.
- Financial Burden Reduction: Focus on reducing financial burdens for low-income individuals by providing essential educational and technological resources at no cost.
- Equity Initiatives: Develop initiatives that specifically aim to promote economic equity by addressing the resource needs of underserved populations.
- Remove Barriers to Access: Implement fine-free policies to ensure all community members can access library resources regardless of their financial situation. Provide transportation assistance or mobile library services to reach underserved areas.
Technological Access and Digital Literacy
- Digital Divide Mitigation: Continuously update and expand technological resources such as digital databases and laptop loans to bridge the digital divide.
- Digital Literacy Programs: Offer comprehensive digital literacy programs that teach essential digital skills for educational and economic empowerment.
- Remote Learning Support: Provide resources and support for remote learning to ensure equitable access to education in the digital age.
Support for Job Seekers
- Job Search Resources: Maintain resources like internet and computer access, resume-building workshops, and job search assistance for job seekers.
- Employability Skills Programs: Develop programs focused on improving employability skills, including computer literacy training and interview preparation.
- Career Counseling: Offer career counseling services to help individuals navigate job markets and career pathways.
Social Safety Nets
- Essential Services: Provide essential services such as access to social services information, government assistance, legal aid, and hygiene facilities for vulnerable populations.
- Safe Spaces: Create and maintain safe spaces for vulnerable individuals to access resources and support without stigma.
- Community Cohesion Programs: Develop programs that promote social interaction and support community cohesion.
Supporting Vulnerable Populations
- Targeted Programs: Design programs and services specifically for vulnerable populations, including the homeless, low-income families, and new immigrants.
- Social Integration Support: Offer services that facilitate social integration and economic mobility, such as language classes and cultural orientation programs.
- Basic Needs Assistance: Provide assistance with basic needs such as food, clothing, and shelter information.
Libraries as Community Barometers
- Community Investment: Ensure libraries are well-maintained and reflect effective governance and investment in community wellbeing.
- Public Awareness: Raise public awareness about the role of libraries in community health and economic priorities.
- Feedback and Improvement: Implement regular feedback mechanisms and community needs assessments to continuously improve services, better supporting economic diversity and inclusion by tailoring programs to specific community needs.
Community Resilience and Networking
- Networking Opportunities: Facilitate programs and events that promote community bonding and networking, enhancing economic resilience.
- Support Networks: Develop support networks that help individuals build relationships leading to economic opportunities and support.
- Community Events: Host community events that encourage local collaboration and mutual support.
Economic Empowerment
- Financial Literacy Workshops: Offer workshops on financial literacy to help individuals manage their finances, understand budgeting, and make informed financial decisions.
- Access to Information: Ensure democratized access to information and educational resources that empower individuals to improve their socio-economic status.
- Empowerment Programs: Develop programs aimed at economic empowerment, contributing to social equality and community wellbeing.
Evidence for Positive Impact
Heavily empirical section, including our panel regression results demonstrated over all positive impacts and trends in impact. Where possible include other methods like COVID-19 shock in recovery. Think of this in three parts: quantitative evidence, themes from focus groups and local research, and literature review
Technical Notes
This is all the specific data manipulation and management, code used in analysis, sources for each and all data, and data files for reference which include (where applicable) margins of error for all measures. OSF repository for Economic Wellbeing Index: https://osf.io/te4v2/