
Building Success from 3rd Grade to High School Completion
Education outcomes are deeply intertwined with the social-emotional experience of children within their local systems: how a learner is encouraged, a child punished, or a group of children systematically excluded. Each of these elements impact on attendance at school, engagement in the classroom, and persistence through 12th grade completion, with proficiency markers along the way. Public libraries support youth by giving direct literacy and learning support with programs. They can also keep kids who aren’t experiencing belonging at school connected to formal institutions and learning pathways.
Read More
Education is a core library outcome so this one will be about targeting what we write. This section will include a synthesis of our interview findings, our analysis of quantitative data, and what other researchers are saying.
Libraries play a multifaceted role in improving education outcomes within communities. Below is a summary of our findings based on the qualitative data we gathered:
- Early Education and Literacy:
- Libraries foster early childhood literacy through partnerships with education centers and schools. They conduct literacy programs and events like storytimes and reading circles, making reading both accessible and appealing to young children.
- Libraries counter the digital age’s distractions by promoting the enduring value of literacy and offering structured environments for focused reading and comprehension skills.
- Support for Parents and Families:
- Libraries serve as essential community nodes for parents, providing a space to connect, share experiences, and access resources supporting child and parent education.
- Programs designed to engage young minds and offer educational tools help parents become active participants in their children’s literacy and educational development. Libraries also mitigate the feelings of isolation that can accompany parenthood by creating spaces for community interaction.
- Bridging Economic Gaps
- Libraries democratize access to education by providing resources to underserved populations, including new immigrants and the economically disadvantaged. They offer free access to information, education, and basic services, thus critical in bridging economic gaps.
- By providing these resources, libraries ensure that everyone, regardless of socioeconomic status, has the opportunity for educational advancement.
- Lifelong Learning
- Libraries are invaluable sites for lifelong learning. They adapt to community needs with diverse educational programs and offer a range of educational and skill-building opportunities, from STEM initiatives for young learners to technology workshops for older adults.
- Libraries support formal and informal education, enhancing students’ learning experiences and providing continual educational resources for adults and senior citizens.
- Technological Literacy
- Libraries have evolved into critical hubs for technological literacy and innovation. They offer programs in STEM, robotics, and emerging technologies like 3D printing, playing a crucial role in bridging the digital divide.
- During the COVID-19 pandemic, libraries became essential centers for remote learning and work, offering resources like laptops and Wi-Fi hotspot loans. Their role in mitigating digital inequities highlights their importance in today’s digital age.

How to Use these Dashboards
This Dashboard is interactive and you can change what you are looking at. Here are some tips to get you started:
- Limit your search: When the headings read “All, All”, it means there are no filters in action and you are seeing the average of All school districts in All states. Type the abbreviation for a US state (data do not include territories), and you’ll see a limited list of counties that are ONLY in the that one state. {If you try to deselect school districts one at a time, you’ll run into error prone results – Tableau just can’t handle that many unique observations on the fly.}
- Geographic filters apply most places: Once you select a state or specific school districts within a state, the filter will apply to all the tables and graphics in the Dashboard except the map. You’ll notice by the map there is a district menu titled “Mapped Districts”. You can select which districts you want to see from this list (limited by the state you selected above).
- Measure Names menu: You can also look at specific measures of Education Outcomes geographically using the drop down menu called “Measure Names”. By default it is showing you the average of all the averages of all our available data put together. The result is nonsense. Select whichever measure you would like to compare across geographies. It will depend on the measure if a higher value is “better” or “worse”. For instance, higher high school non-completion could be viewed as bad where higher proficiency scores could be good. It will depend on your judgement!
- Year Filter: You can filter the map by year. It won’t change the other charts and tables. When more than one year is selected, the sum across years is displayed.
- Map: The map has its own set of controls on the left of the map window. The magnifier will let you search the map by county or state name and zoom in to the center of your selected location. Plus and minus symbols will zoom in and out. Home will return to a view of the continental US (zoom out to view Alaska and Hawaii). Clicking the right facing arrow will reveal a menu for mouse controls. From here you can say you would like to cruise around the map by selecting the four way arrows, clicking, and dragging the map to change the view. Those options with dotted outlines are varied ways of selecting locations on the map.
- Widen your view: There are two ways to expand the dashboard beyond the container our website forces. You can select “View on Tableau Public” on the bottom left of the window. This will take you to the dashboard on Tableau Public’s website. You can also select full screen by clicking the square between download and share at the bottom right of the window.
Report out with Download & Share features: The bottom right of the dashboard frame gives a bunch of useful tools for viewing. The rectangle with the down arrow will download your cutomized result in whatever format you prefer (including the table we used to make all this!). You can also use the share button to send a link to your customized view or the original view.
How to Read the Dashboard
The Education Outcomes Index used in the calculator is the sum of measures, standardized at the density within US region level, with data taken from US Census Bureau, Department of Education, and the Stanford Education Data Archive:
- High School Completion: Portions of the school district geography population aged 16-19 that neither holds a diploma (or equivalency) nor is enrolled in school (High School Non-completers), and 9th graders who graduate high school 4 years later (Graduation Rate). Although both of these data are percentages, they are calculated by different organizations and display differently. Read 0.06 in HS Non-completers as 6% drop out rate, and 84.66 in Graduation Rate as 84.7% average cohort 4-year graduation rate.
- Math & Reading Proficiency: The Stanford Education Data Archive (SEDA) provides proficiency rates which have been standardized across state threshold differences, test types, and years to make them comparable across multiple dimensions. While helpful for researchers, it can make the measures harder to interpret. Read Math Proficiency equal to .03 as 3/100 of a grade level higher than the statistical mean of the comparison group on 3rd grade state Math tests and Reading Proficiency of -.04 as 4/100 of a grade lower than the mean. Sort of like Z-scores described below and elsewhere in this study, if you see a positive number, it means better than average, a negative number means worse than average, and the further from zero gives the magnitude of that “better” or “worse”.
The Dashboard describes Education Outcomes in four ways:
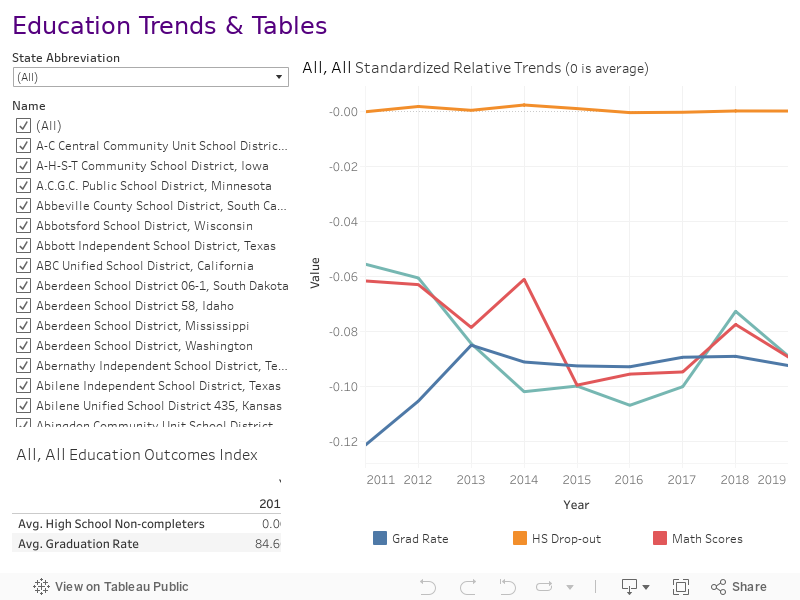
- Trend lines: Each line represents one of the measures but the values are given in z-scores. This is a standardization method where the average is 0 and the deviation is 1. The group of school districts used to create the “standard” is every level of rurality or urbanity within every US region. At the national level, even though the lines look very dynamic, all the values are very small. Once you limit the dashboard to a single state or school district, read this graphic as “Relative to other school districts serving similarly rural (urban) communities in my region, my district (state) has improving (or declining) measures.
- Tables: There are two tables with measure averages. All are based on rates or percentages already scaled by population size, but not further adjusted for region or rurality. Indexed measures named above are given for two years: 2011 and 2019. Inequality Measures are given as rate differences in standardized Math and Reading proficiency. So, Avg. Female Math 3rd Gap is calculated by SEDA, and is calculated historically advantaged group minus disadvantaged group. For all “Gap” variables, the closer to 0, the less inequality between people based on reported characteristics, and the more positive, the more the majority group has the advantage, the more negative, the more the minoritized group has the advantage. Read Female Math 3rd Gap of .054 as 3rd grade girls score 5/100 of a grade level worse than their male counterparts, and Female Reading 8th Gap of -.169 as 8th grade girls score 16/100 of a grade level better than their male counterparts.
- Interpretation of Index Table: It appears that nationally, school districts are trending toward greater rates of high school completion and within 4 years. Further, school districts are diverging from the average while improving in Math but declining in Reading.
- Interpretation of Inequality Table: Nationally, inequality in outcomes increased between 2011 and 2019, across student categories with few exceptions like Reading Language Arts differences between Hispanic and White non-Hispanic students.
- Map: The interpretation above tells a national average story, but there is a wide variety of outcomes across US states and school districts. The map can help you see differences nationally, within a state, and changes over time. Here is an example of use and interpretation of a measure:
- Set up: Select “Female Math 3rd Gap” from the Measure Values menu. We haven’t yet filtered by year, so the amounts are the sum of the differences over all 13 years in our data.
- Observations: Looking at the nation as a whole, I can see state by state boundaries really clearly. For instance, Texas is dark blue and Arkansas is deep orange. Further, I notice that the color scale legend goes from -92 to 263.7. Let’s filter by year to make observations more interpretable. Limiting to just 2017 using the slider, the range is now -14.6 to 36.5.
- Interpretations: The color legend indicates that although there are places where 3rd grade girls are scoring significantly higher than boys, at their most extreme ends, the inequality is over 2 times higher where boys are scoring higher. Because we have a map visualization, we can see that there are specific states (California, Iowa, Michigan, Texas) are driving the upper extremes of inequality and also that shades of blue are more common across the nation than any shade of orange, meaning that male outcomes advantage in this measure is more widespread than female outcomes advantage.
Outcomes are Co-Produced - Coming Soon
Mediation analysis results, discussion of the library contribution in panel regression models to this outcome overall, and then talk about the mechanisms at work (why would there be positive/negative relationships, and when can we use causal language?)
Service Considerations
Early Education and Literacy
- Expand Partnerships: Strengthen and expand partnerships with local education centers, schools, and early childhood organizations to broaden the reach and impact of literacy programs.
- Engaging Programs: Develop and sustain engaging programs such as storytimes, reading circles, and literacy workshops tailored for different age groups, focusing on making reading enjoyable and accessible.
- Digital Literacy: Incorporate digital literacy alongside traditional reading programs to help children navigate and benefit from digital resources while emphasizing the importance of reading and comprehension skills.
Support for Parents and Families
- Resource Centers: Establish dedicated resource centers within libraries that provide information, educational tools, and support services for parents and families.
- Interactive Spaces: Create interactive and safe spaces for parents and children to engage in educational activities together, fostering a sense of community and shared learning.
- Parent Education: Offer workshops and seminars aimed at equipping parents with skills and knowledge to support their children’s educational journey, including digital literacy for parents.
Bridging Economic Gaps
- Free Access to Resources: Ensure continued and expanded free access to educational resources, information, and basic services for underserved populations, including new immigrants and economically disadvantaged individuals.
- Outreach Programs: Develop outreach programs that specifically target marginalized communities to raise awareness about the resources and services available at the library.
- Support Services: Provide support services such as career counseling, job search assistance, and basic financial literacy workshops to help bridge economic gaps.
Lifelong Learning
- Diverse Educational Programs: Offer a wide range of educational programs catering to all age groups, from young learners to senior citizens, including STEM initiatives, arts and crafts, and cultural events.
- Skill-building Workshops: Implement skill-building workshops that focus on practical and emerging skills, ensuring programs are responsive to community needs and interests.
- Intergenerational Learning: Promote intergenerational learning opportunities where older adults and young learners can share knowledge and experiences, fostering mutual learning and community bonding.
Technological Literacy
- Technology Access: Ensure libraries provide access to the latest technology, including computers, tablets, Wi-Fi hotspots, and emerging technologies like 3D printing and robotics.
- STEM Programs: Develop and sustain comprehensive STEM programs that include hands-on activities, workshops, and maker spaces to foster technological literacy and innovation.
- Digital Equity: Focus on bridging the digital divide by providing resources and support for remote learning and work, including training sessions on digital tools and platforms.
Community Engagement and Feedback
- Regular Surveys and Feedback: Conduct regular surveys and community feedback sessions to understand the evolving needs and preferences of library users.
- Advisory Committees: Establish advisory committees composed of community members to provide ongoing input and guidance on library services and programs.
- Inclusive Programming: Ensure that all programs and services are inclusive and culturally relevant, reflecting the diversity of the community.
Evidence for Positive Impact - Coming Soon
Heavily empirical section, including our panel regression results demonstrated over all positive impacts and trends in impact. Where possible include other methods like COVID-19 shock in recovery. Think of this in three parts: quantitative evidence, themes from focus groups and local research, and literature review
Technical Notes - Coming Soon
This is all the specific data manipulation and management, code used in analysis, sources for each and all data, and data files for reference which include (where applicable) margins of error for all measures. OSF repository for Education Outcomes index: https://osf.io/byw4c/